Get ahead
VMware offers training and certification to turbo-charge your progress.
Learn moreOn behalf of the team, I am pleased to announce the general availability of Spring Cloud Data Flow 1.2 across a range of platforms
Here are the relevant links to documentation and getting started guides.
Local: Quick Start, Getting Started Guide
Cloud Foundry: Getting Started Guide
YARN: Getting Started Guide
Kubernetes: Getting Started Guide
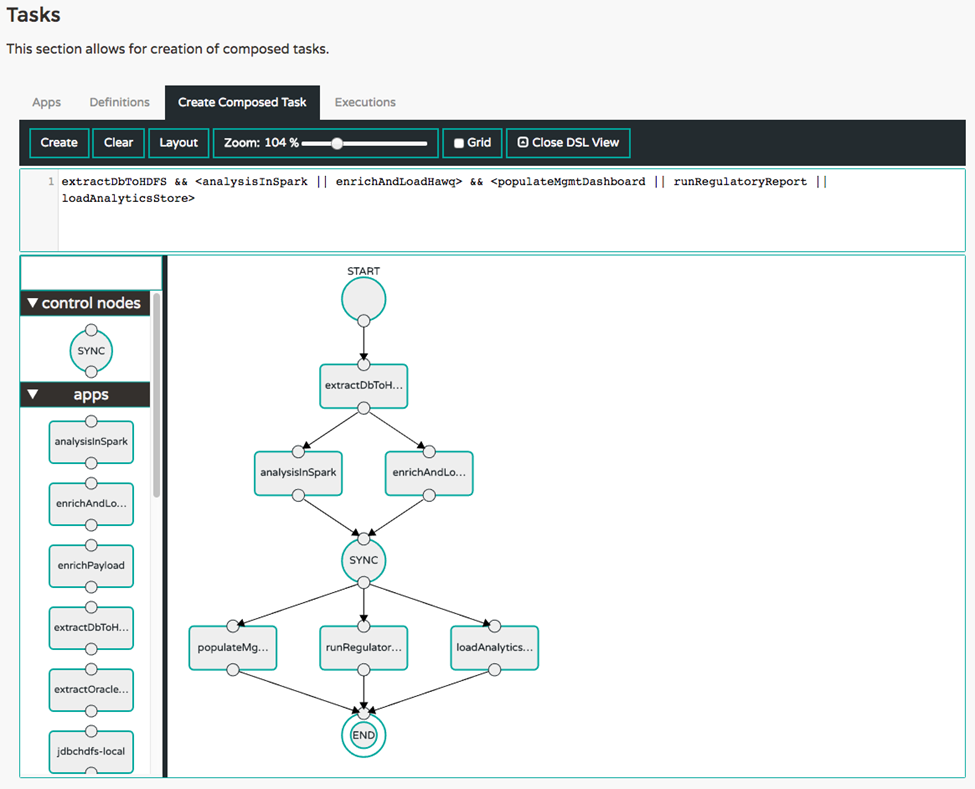
This release introduces Composed Tasks ! This feature provides the ability to orchestrate a flow of tasks as a cohesive unit-of-work. A complex ETL pipeline may include executions in sequence, parallel, conditional transitions, or a combination of all of the above. The composed task feature comes with DSL primitives and an interactive graphical interface to quickly build these type of topologies more easily. You can read more about it from the reference guide.
An ETL job, for example, may include multiple steps. Each step in the topology can be built as a finite short-lived Spring Cloud Task application. The orchestration of multiple tasks as steps can be easily defined with the help of the Data Flow Task DSL.
task create simple-etl --definition "extractDbToHDFS && <analysisInSpark || enrichAndLoadHawq> && <populateMgmtDashboard || runRegulatoryReport || loadAnalyticsStore>"
This will first run extractDbToHDFS and then run analysisInSpark and enrichAndLoadHawq in parallel, waiting for the both of them to complete before running the three remaining tasks in parallel and waiting for them to all complete before ending the job. The graphical representation of this topology looks like the following.

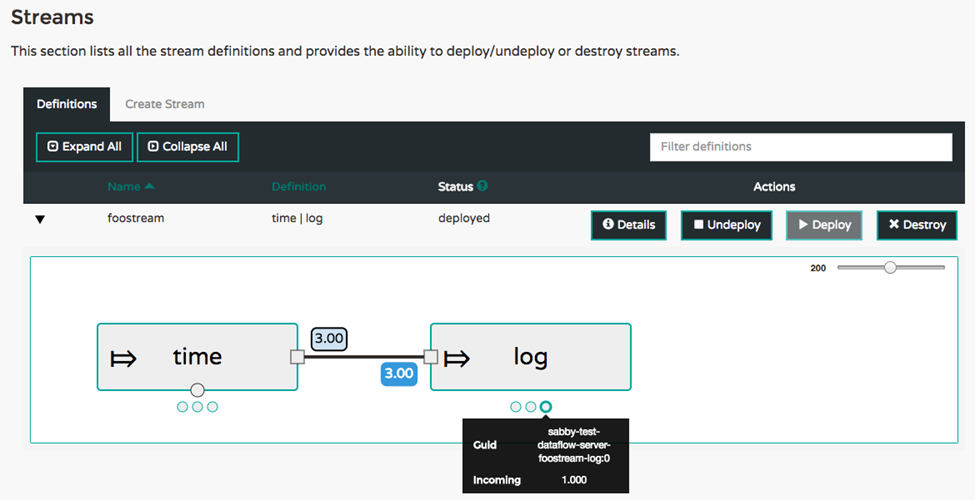
Real-time metrics are now part of the operational view of deployed streams. The applications that are part of a stream publish metrics contained in their Spring Boot /metrics actuator endpoint. This includes send and receive messages rates. A new server, the Spring Cloud Data Flow Metrics Collector, collects these metrics and calculates aggregate message rates. The Data Flow server queries the Metrics Collector to support showing message rates in the UI and in the shell. For more details about the architecture, refer to the Monitoring Deployed Applications Section in the reference guide.
The screenshot below shows the aggregate message rates for a time | log stream with three instances of the time and log applications. Each dot below the main application box shows the message rates for each individual application along with a guid value that can be used to identify the application on the platform where they are running.

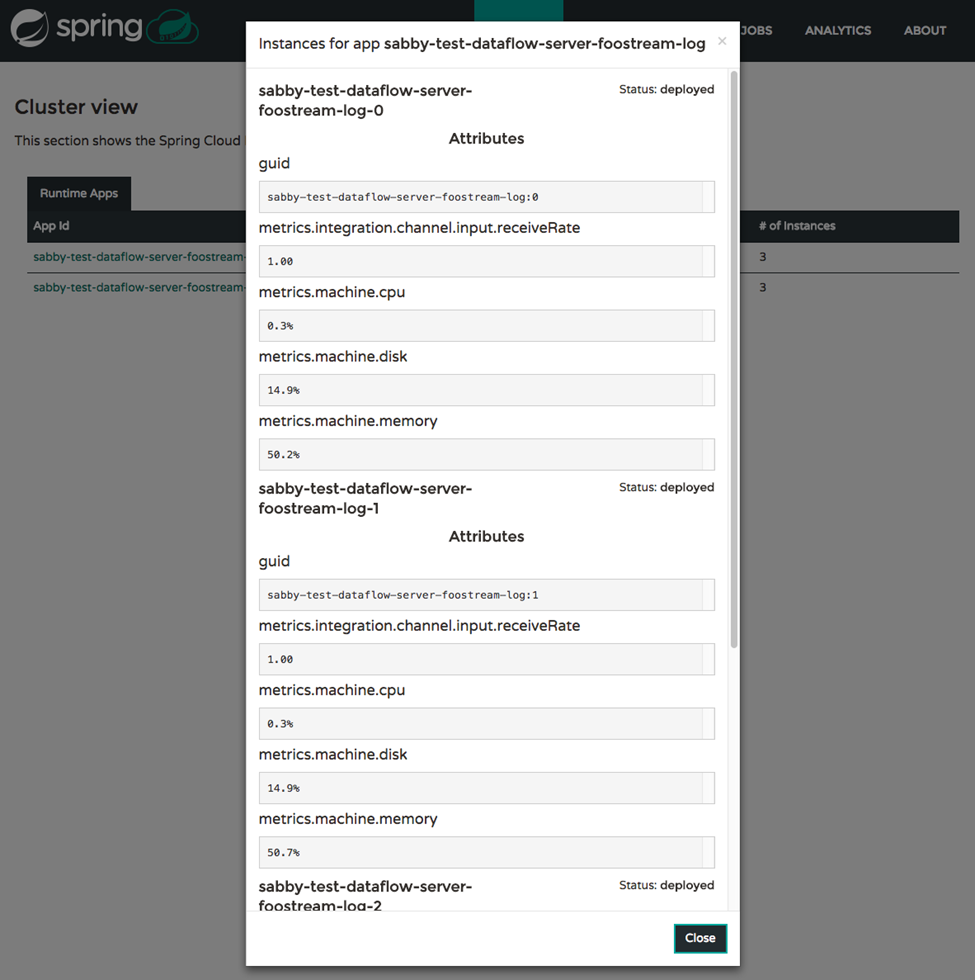
The Runtime tab, shown below, also had improvements to show message rates and any other metrics exposed by the platform. For the script savvy users, the shell experience also includes these details via the runtime apps command.

The companion artifact support introduced in 1.2 M3 has had some improvements. The bulk registration workflow now eagerly resolves and downloads the metadata artifacts for all the out-of-the-box applications. This comes handy in the Shell or UI when reviewing the supported properties for each application.
This change will provide an additional option for REST-API users. Instead of providing a username:password combination via BasicAuth, users will now have the ability to retrieve an OAuth2 Access token from their OAuth2 provider directly and then provide the Access Token in the HTTP header, when invoking RESTful calls against a secured Spring Cloud Data Flow setup.
Add role-based access control to define who has access to create, deploy, destroy, or view streams/tasks. This works seamlessly in coordination with the supported authentication methods.
A new REST endpoint and About page in the Dashboard to collect server implementation details to the clipboard for use in bug reporting.
The Stream App Starters Bacon.RELEASE is now generally available which provides you a range of sources, processors, and sinks to get started creating stream. All the out-of-the-box stream applications build upon Spring Cloud Stream Chelsea.RELEASE and Spring Cloud Dalston.RELEASE foundation. There were several enhancements and bug-fixes to the existing applications and this release-train also brings new applications such as MongoDB-sink, Aggregator-processor, Header-Enricher-processor, and PGCopy-sink.
For convenience, we have generated the bit.ly links that includes the latest coordinates for docker and maven artifacts.
The Task App Starters Belmont.RELEASE release is now complete. To support Composed Task feature in Spring Cloud Data Flow, we have added a new out-of-the-box application named Composed Task Runner. This is a task that executes others tasks in a directed graph as specified by a DSL that is passed in via the --graph command line argument.
The Belmont.RELEASE builds upon Spring Cloud Task 1.2 RELEASE and Spring Cloud Dalston.RELEASE foundation.
For convenience, we have generated the bit.ly links that includes the latest coordinates for docker and maven artifacts.
An immediate goal is adding more automated integration tests and to expose this as an additional user facing feature. You can track that work here.
Beyond the 1.2.x line, we are going to start planning for the 2.0 version. Some general themes are support for deploying individual applications and keeping track of application deployment properties and metadata such as the application version. This functionality would build up into supporting a rich Continuous Delivery theme at the application level that also extends to "editing" streams at runtime. In addition, we are also looking into supporting functions, either "in-line" as Java code or compiled java.util.Function s to be a first class programming model for data processing a stream.
Feedback is important. Please reach out to us in StackOverflow and GitHub for questions and feature requests. We also welcome contributions! Any help improving the Spring Cloud Data Flow ecosystem is appreciated.